Self-built · Trade & Supply Chain Analytics
Tariff Risk Intelligence for US Imports
Self-Built · Open Source
- Location Boston, MA
- Duration 2025 – 2026
- Type Self-Built Project
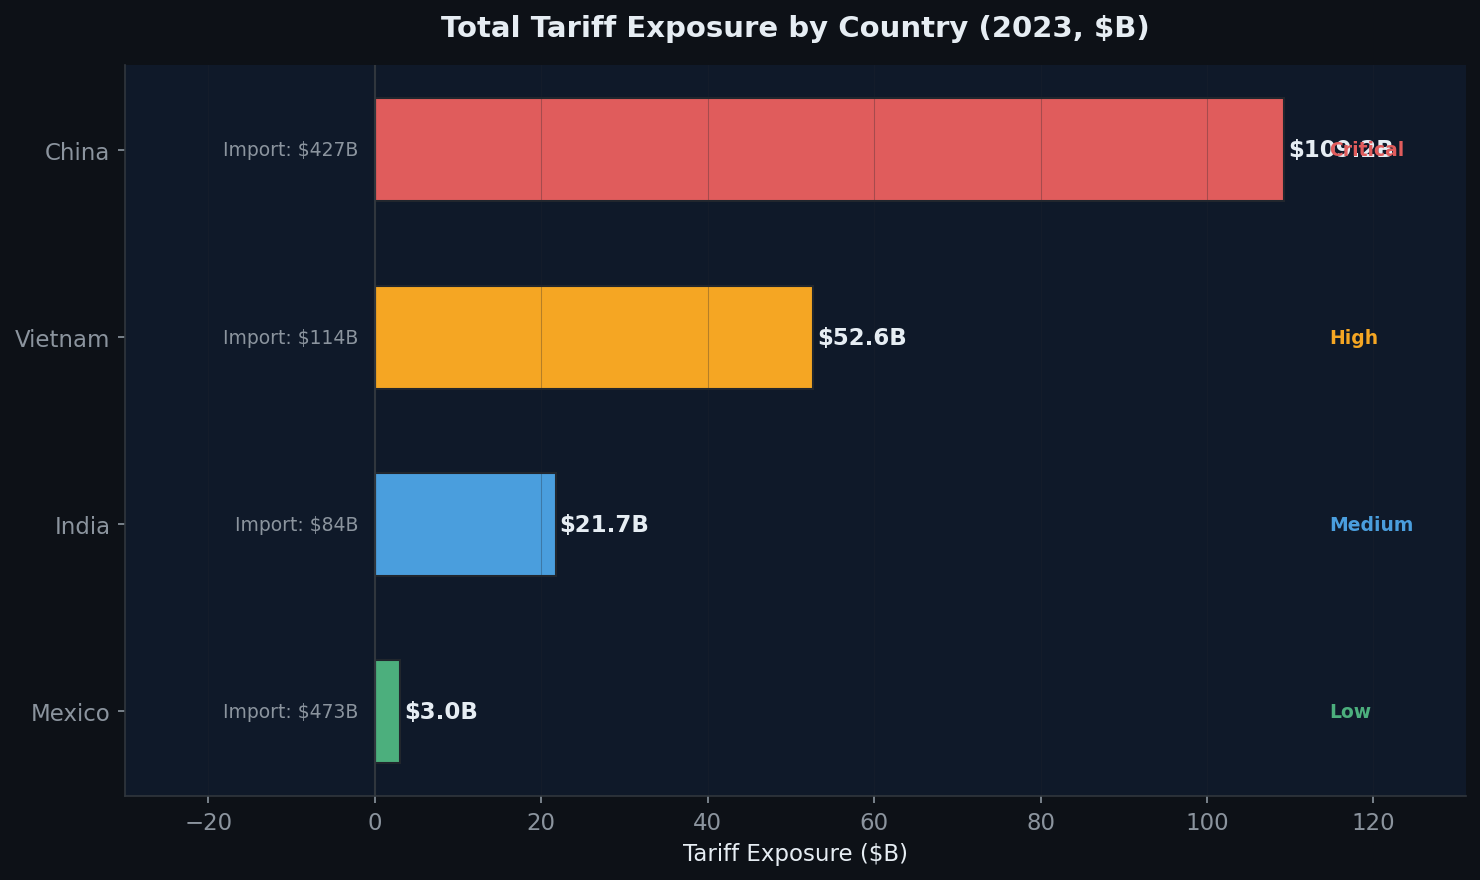
US companies importing goods from China, Vietnam, India, and Mexico are sitting on $221.8 billion in annual tariff cost exposure at current rates. A 25-point tariff shock would add another $192.6 billion to that bill, enough to erode 71% of average gross margins on the affected categories. The information needed to manage that risk is technically public, scattered across the Census Bureau, the Bureau of Labor Statistics, and the Federal Register. But almost no one in the operations or trade analyst seat actually pulls it that way. Most companies are still managing exposure through manual spreadsheets, gut feel, and reactive moves after tariff changes hit the news. I built this tool because that gap kept showing up in news cycles, client conversations, and case studies, and I wanted to see if a single analyst with the right pipeline could close it.
I built Tariff Shock Navigator as an end-to-end, reproducible Python pipeline that ingests live US government data and turns it into executive-ready risk intelligence. The system is open source and lives on GitHub.
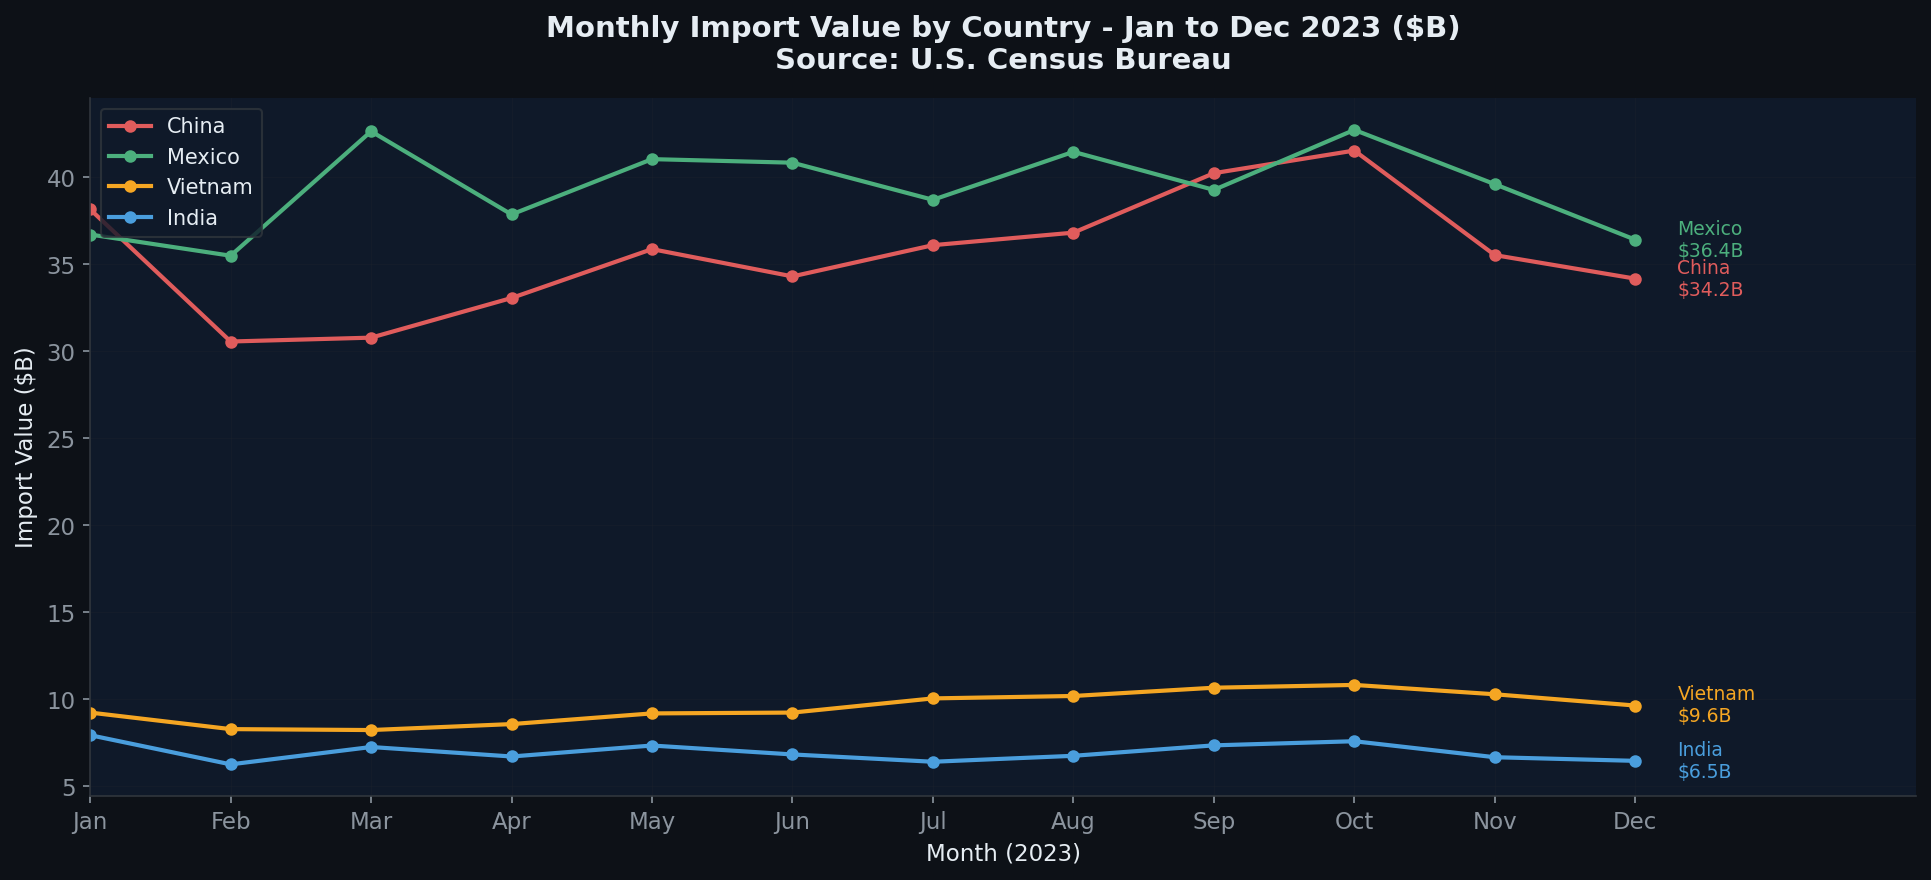
The first piece was data engineering. I built scripts that pull live data from three free government APIs: the US Census Bureau International Trade API for 2023 US imports by HS2 chapter and country, the BLS Import Price Program for monthly price indices across 35 months, and the Federal Register API for tariff policy documents since January 2024. Every number in the pipeline is traceable back to a real API response. No Kaggle datasets, no synthetic data.
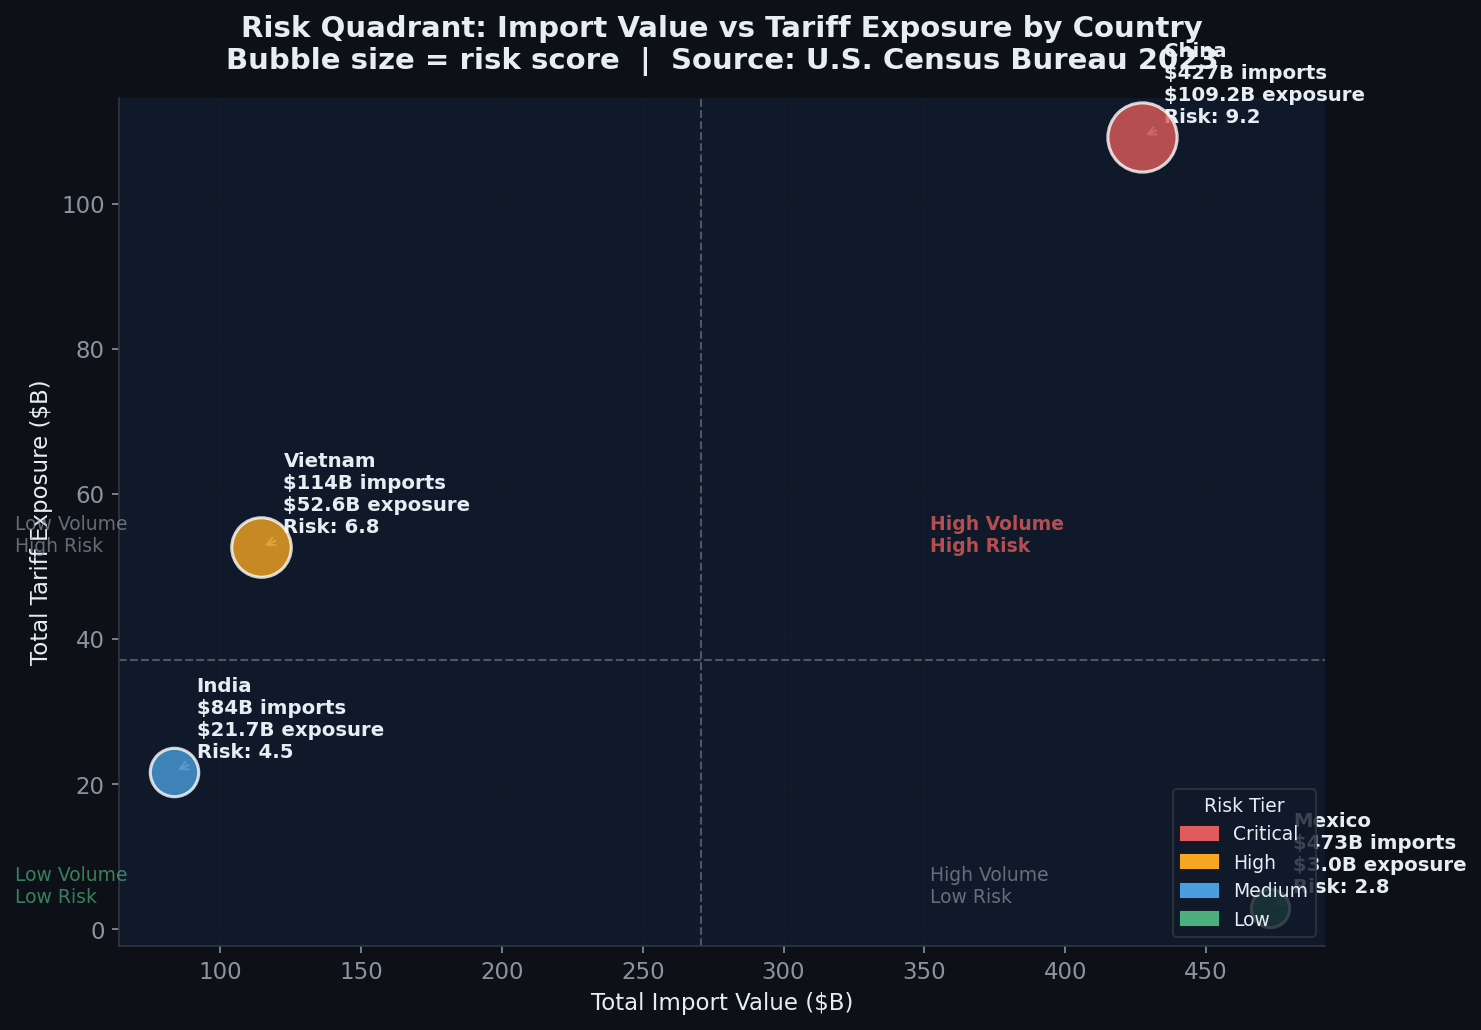
The second piece was the risk scoring engine. I built a composite tariff risk score that blends tariff rate exposure, country-level policy risk, and import dollar volume using a weighted formula (40/35/25). The output is a scored 0-10 risk rating for every country-chapter pair in the dataset, with 20 of 40 pairs flagged as critical risk combinations.
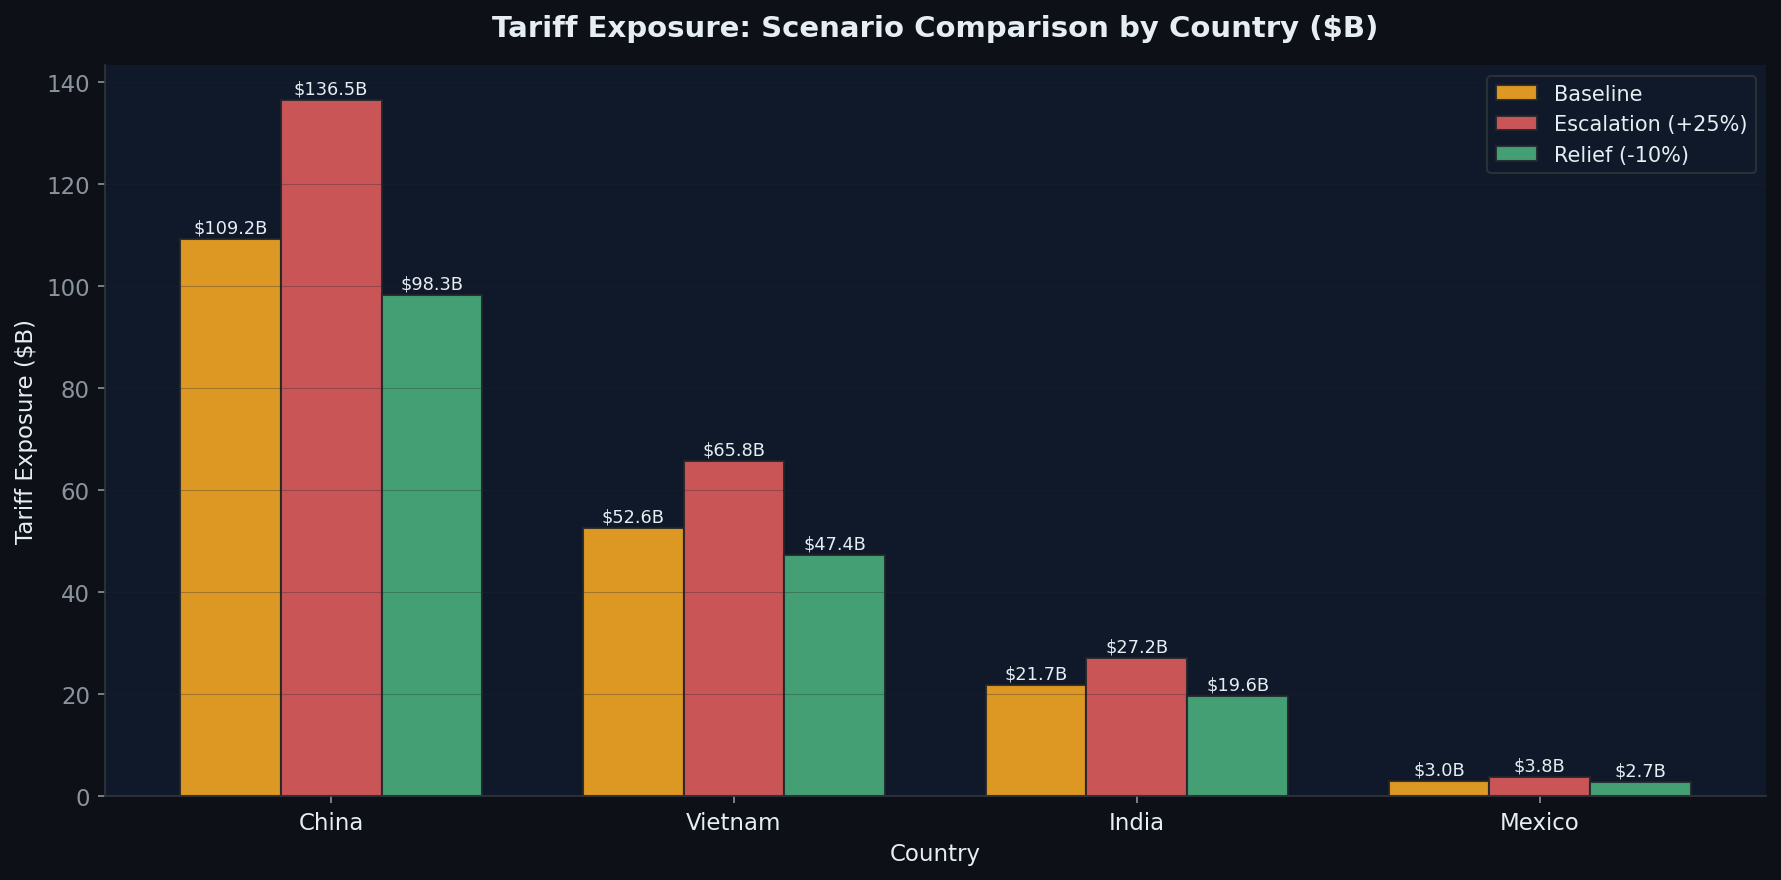
The third piece was scenario simulation. The tool models three shock scenarios (Base, Moderate, Severe) against current tariff levels, projecting the additional cost exposure each scenario would create across countries and product categories. That output gives operations and trade analysts a way to quantify exposure in advance instead of reacting after a policy change.
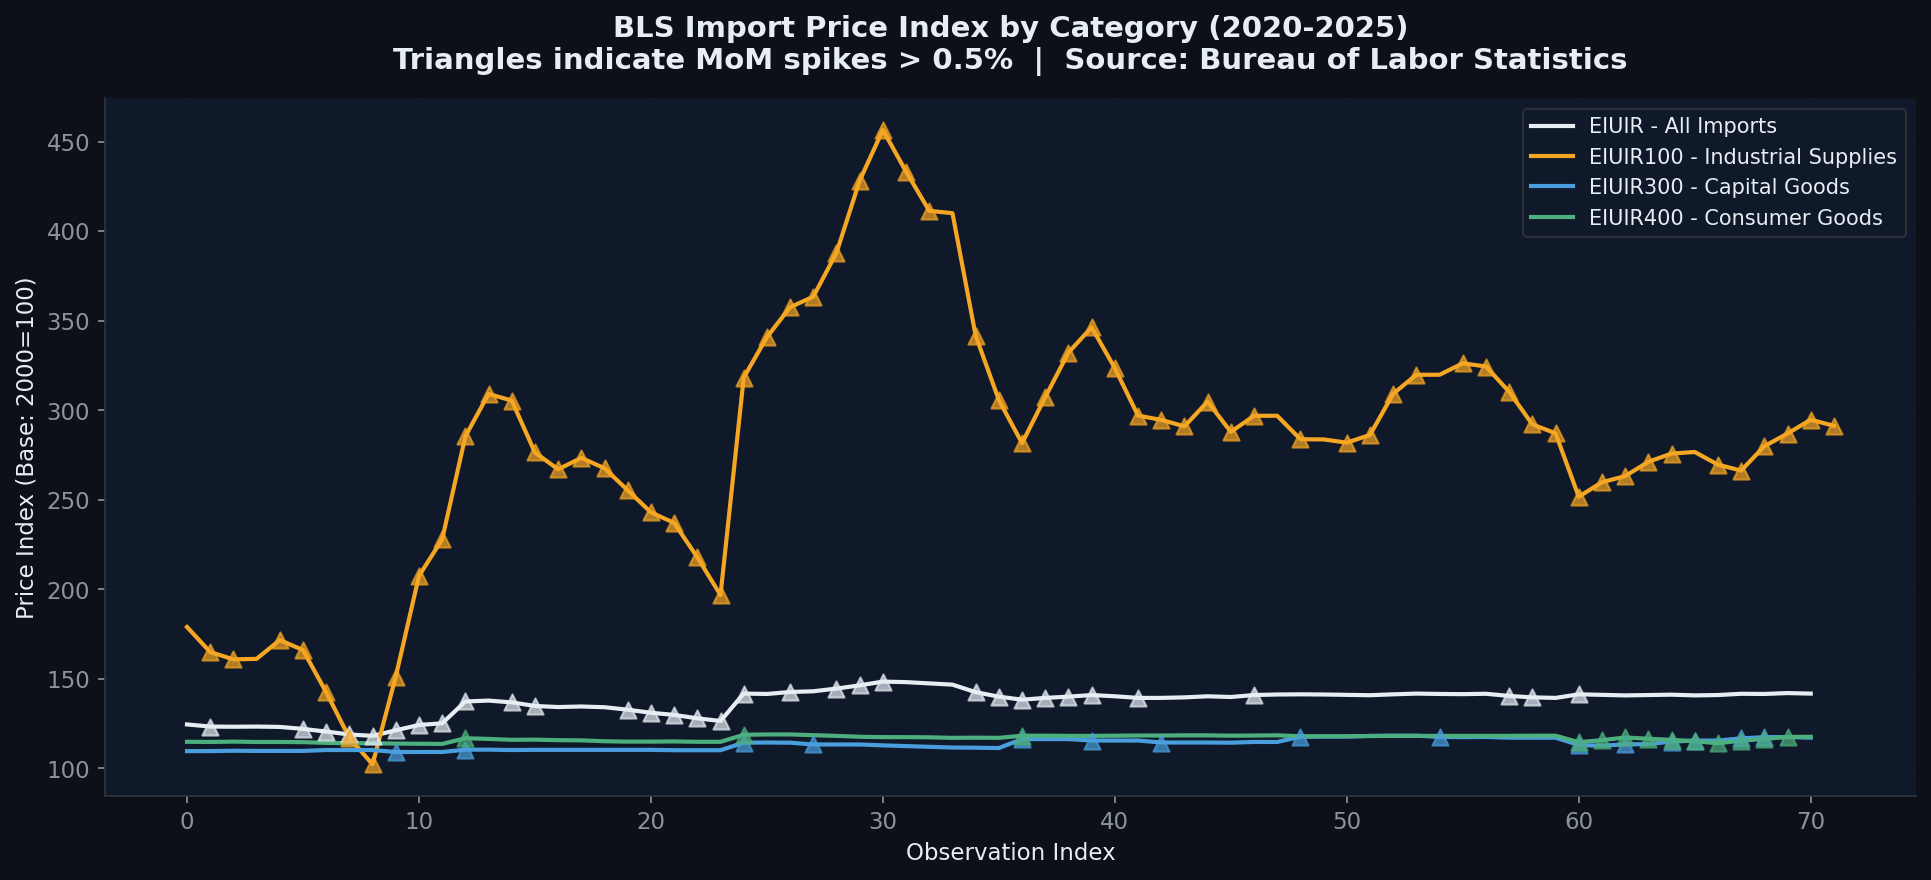
The fourth piece was trend analysis. I built a BLS price trend module with automated spike detection across 35 months of import price index data, surfacing seven historical spike months and the deflationary trend in capital goods electronics.
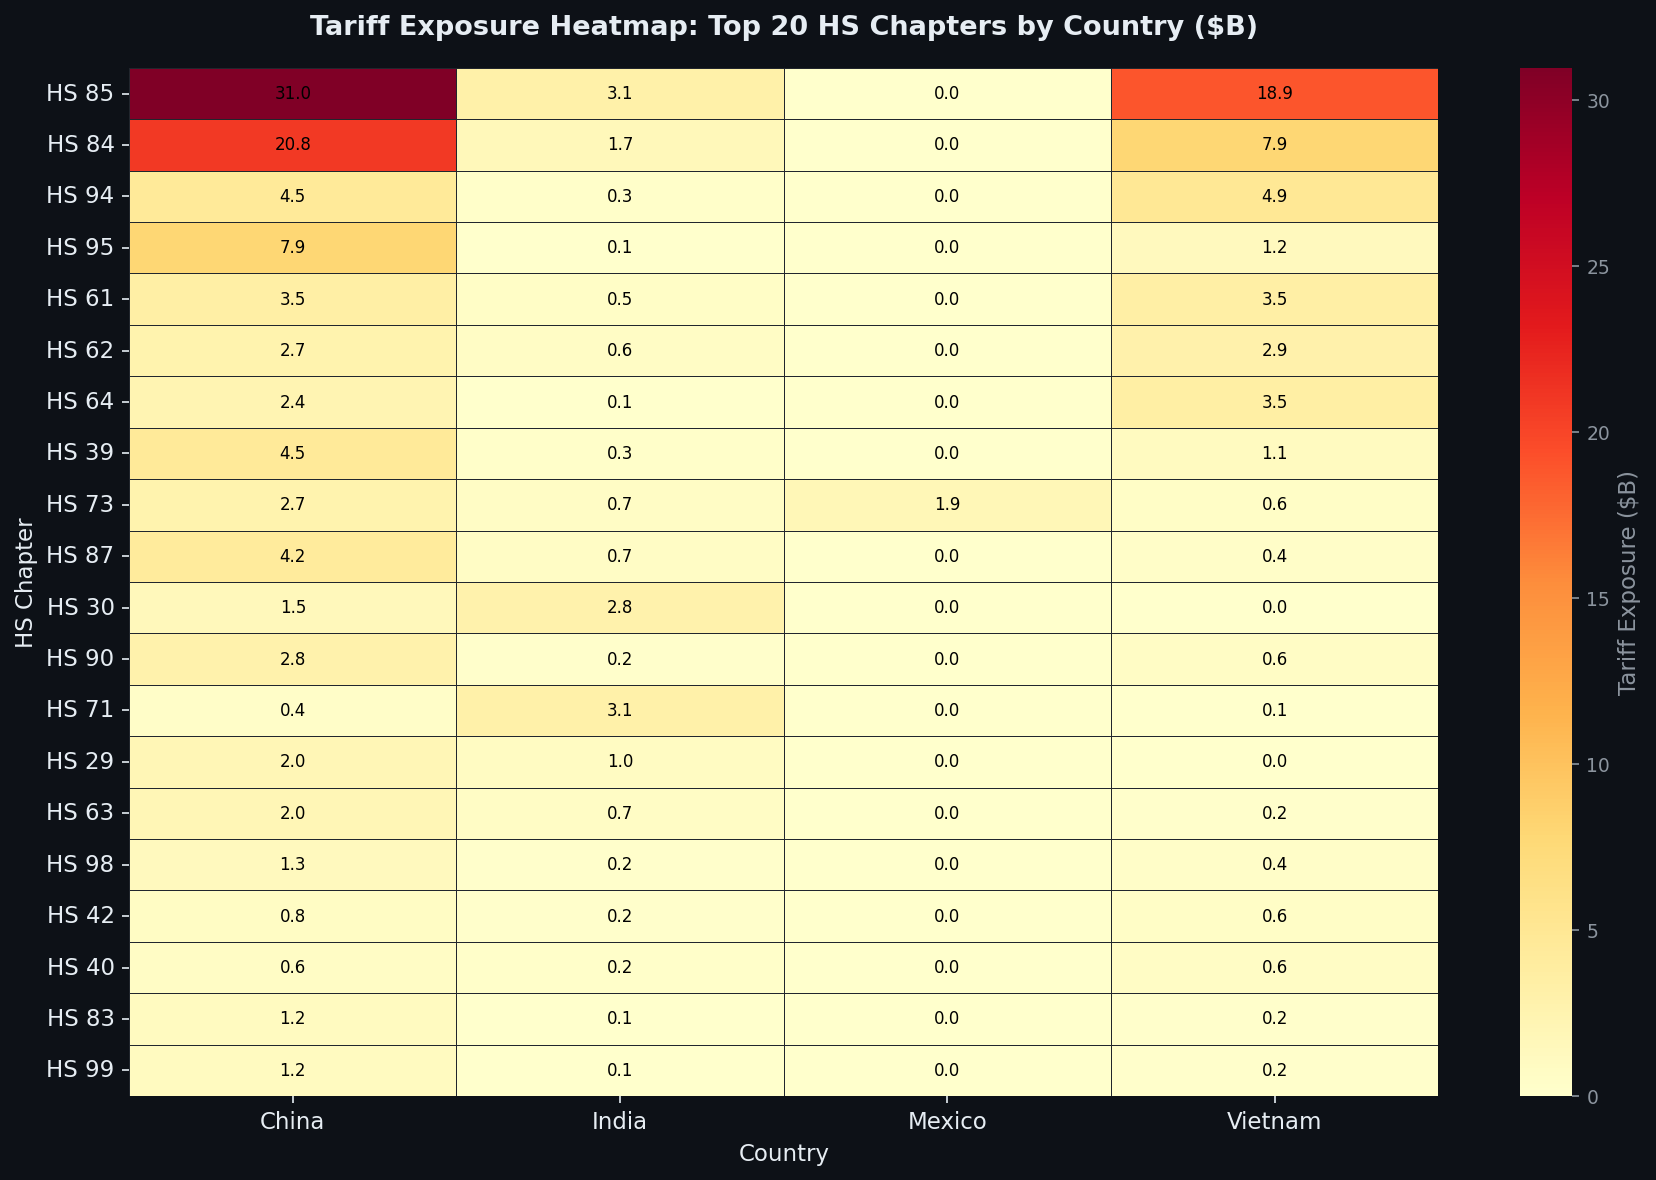
The fifth piece was the executive layer. Rather than leaving the analysis as a CSV, I wrote a script that auto-generates a full executive briefing in Markdown directly from the processed data, along with six matplotlib visualizations covering country-level risk, HS chapter exposure, scenario impact, BLS price trends, import share, and a country × product exposure heatmap. The brief and the charts regenerate every time the underlying data is refreshed.
The whole pipeline is documented through a business requirements document, an as-is/to-be process analysis, and a KPI dictionary with formulas, thresholds, and owners.
The pipeline auto-generates six visualizations directly from the live API data. Every chart regenerates on each data refresh, so the views stay current as tariff rates, imports, and price indices shift.